Content
- Introduction: Kubernetes Incident Response
- Why Is Kubernetes Incident Response Critical?
- Kubernetes Incident Response: Building on Recovery Architecture
- Common Kubernetes Incidents and Practical Solutions
- Preparing for Kubernetes Incidents: Key Strategies
- Step-by-Step Kubernetes Incident Response Process
- Conclusion: Kubernetes Incident Response
- FAQs
Introduction: Kubernetes Incident Response
Kubernetes has transformed the deployment and management of containerized applications. However, no matter how advanced the system is, incidents are bound to happen. Whether it’s a minor glitch or a major outage, being prepared can truly make the difference between a swift recovery and prolonged downtime. In this guide, we will walk you through everything you need to know about Kubernetes Incident Response starting with the basics and moving on to practical steps and tools you can use to effectively handle any situation.
Why Is Kubernetes Incident Response Critical?
First things first, why should you care about incident response in Kubernetes? Modern applications depend on seamless operation. When something goes wrong—whether it’s a failed pod, a misconfigured deployment, or a network breakdown—it can impact end-users, lead to financial losses, and harm your reputation.
Having a robust incident response plan is essential because it helps you:
- Restore services quickly: Minimize downtime and maintain reliability.
- Protect data integrity: Ensure sensitive information remains secure.
- Enhance team confidence: Ensure everyone understands their role during a crisis.
In short, a solid incident response strategy keeps your systems resilient and your team prepared.
Kubernetes Incident Response: Building on Recovery Architecture
To handle incidents effectively, you need to understand the core components of Kubernetes. So, let’s break down the key parts and their roles:
Core Components of Kubernetes Incident Response:
- Pods: Now, when it comes to pods, these are the smallest deployable units in Kubernetes. Essentially, they’re like little bundles that can house one or more containers, all of which share resources such as storage and networking. In other words, think of them as the fundamental building blocks that ensure your app remains functional and efficient.
- Control Plane: But how does it all stay organized? That’s the job of the control plane, which acts as the brain of the cluster. It’s responsible for managing the overall state of your system and includes components like the API server, scheduler, and controller manager to keep everything in check.
- Services: Finally, let’s talk about services. They ensure your application remains accessible by providing stable endpoints. Even if your pods’ IP addresses change, services step in to seamlessly direct traffic to the right pods—kind of like having a personal traffic coordinator for your app.
How Incidents Affect These Components:
Understanding where issues can arise helps you diagnose problems faster. For example:
- Node Failures: If a node crashes, it’s a big problem—because all the pods running on that node become unavailable. It’s like losing the whole team when the leader goes down.
- Pod Crashes: Sometimes, it’s not the node, but the pod itself that crashes. This can happen due to application bugs or if the pod hits resource limits. It’s like a worker getting overwhelmed and unable to do their job.
- Network Issues: Another common issue is network problems. If communication between services breaks down, it can disrupt the entire application. Imagine trying to send a message and the connection keeps failing—nothing gets done.
This foundational knowledge allows you to target your troubleshooting efforts effectively.
Common Kubernetes Incidents and Practical Solutions
Now that we’ve covered the basics, let’s explore common incidents you might encounter and how to address them. Each scenario requires a different approach, but the principles remain the same: detect, contain, analyze, and recover.
1. Node Failures
Scenario: A node goes offline, taking down the pods it was hosting.
How to respond:
- Check Node Status: First, to identify a failed node, you can use the command
kubectl get nodes. Therefore, This will give you a list of all nodes and their current status, helping you pinpoint the one that’s having issues. - Inspect Events: Once you’ve found the problematic node, you can dive deeper by running
kubectl describe node <node-name>. This command will show you recent events and conditions related to that node, so you can better understand what went wrong. - Redistribute workloads: Ensure your application uses high availability (HA) settings so Kubernetes can reschedule pods to healthy nodes automatically.
Prevention tip:
Implement auto-scaling groups and health checks. This ensures failing nodes are detected and replaced automatically, reducing manual intervention.
2. Pod Crashes
Scenario: A pod fails because of a bug or misconfiguration.
How to respond:
- Review Logs: To begin troubleshooting, you should first review the logs. Therefore, Simply run
kubectl logs <pod-name>. By doing this, you’ll be able to see any errors or issues that may have caused the pod to crash, which will give you a clearer picture of what went wrong. - Examine Events: Once you’ve checked the logs, the next step is to examine the pod’s events. You can accomplish this by running the
kubectl describe pod<pod-name>command. So, this command will provide you with a detailed view of the events and conditions that led up to the crash, helping you understand the root cause. - Restart the Pod: If the issue seems temporary or resolved after examining the logs and events, you might want to restart the pod. To do this, simply run
kubectl delete pod <pod-name>. Don’t worry—Kubernetes will automatically recreate the pod, effectively giving it a fresh start and often resolving the issue.
Prevention tip:
Set appropriate resource limits and requests in your YAML files. This prevents pods from consuming too many resources and crashing unexpectedly.
Preparing for Kubernetes Incidents: Key Strategies
Preparation is half the battle won. By setting up the right systems and processes in advance, you can handle incidents more effectively when they occur.
1. Implement Robust Monitoring and Alerts
Monitoring tools like Prometheus and Grafana provide real-time insights into your Kubernetes environment. They help you detect issues early and take corrective action before things escalate.
Practical tip:
Configure alerts for critical metrics like CPU usage, memory consumption, and network traffic. Configure notifications to be sent via email or Slack, so you’re always in the loop.
2. Develop a Comprehensive Incident Response Plan
An incident response plan is like a roadmap. It outlines the steps your team needs to follow during an incident, ensuring a coordinated response.
Key elements of a good plan:
- Roles and responsibilities: Clearly outline each person’s tasks and duties during an incident.
- Escalation procedures: Know when and how to escalate issues to senior management or external support.
- Communication plans: Have a strategy for communicating with both internal teams and external stakeholders.
Why it matters:
A well-documented plan eliminates confusion and ensures everyone knows their role, even in high-pressure situations.
Step-by-Step Kubernetes Incident Response Process
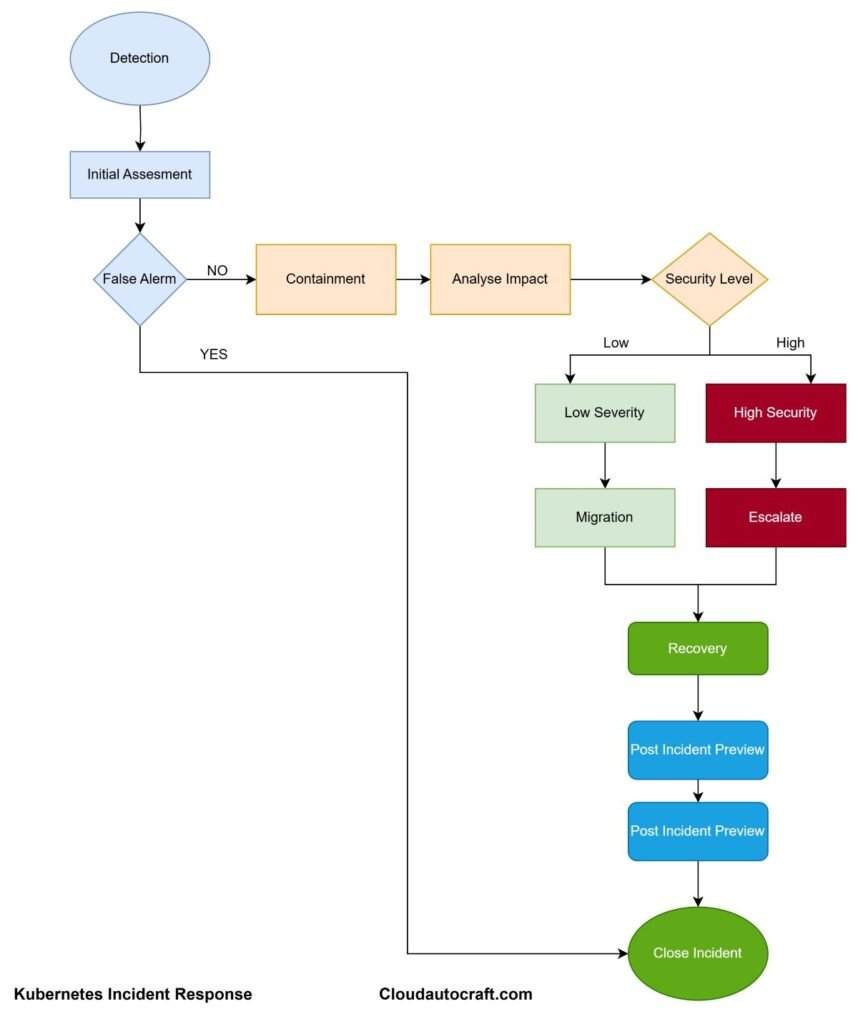
Handling an incident involves four main steps: detect, contain, analyze, and recover. Let’s break down each step:
Step 1: Detection and Identification
Tools to Use:
- Prometheus: To start, use Prometheus to monitor key metrics across your Kubernetes environment. You can set up alerts to notify you of any anomalies, allowing you to stay ahead of potential issues.
- ELK Stack: In addition, the ELK stack (Elasticsearch, Logstash, and Kibana) is invaluable for collecting and analyzing logs. It provides deeper insights into what’s happening in your system, helping you pinpoint issues more efficiently.
Action: Once you’ve set up your tools, the next step is to quickly identify the source of the problem. Look for signs of resource exhaustion, network issues, or application errors. By narrowing down the cause, you can take appropriate action to resolve the issue promptly.
Step 2: Containment and Mitigation
Goal: The primary goal is to prevent the issue from affecting other parts of the system, ensuring that the impact is contained and minimal.
Example: For instance, if a misconfigured pod is causing high CPU usage, it’s important to isolate or restart the pod to prevent it from affecting other services. Similarly, if there’s a security breach, consider temporarily limiting external access to protect the system while you address the issue.
Step 3: Root Cause Analysis
Understanding why the incident occurred is crucial for preventing future issues and ensuring your system’s stability moving forward.
Techniques:
- Review Logs and Events: Start by reviewing the logs and events. Look for patterns or anomalies that could shed light on what triggered the incident, helping you understand the underlying cause.
- Check Recent Changes: Additionally, check for any recent changes in your system. Sometimes, a recent deployment or configuration update can be the culprit, so it’s important to investigate those changes closely to identify any potential issues.
Step 4: Recovery and Restoration
Once the issue is contained and analyzed, the next step is to focus on restoring normal operations as quickly as possible.
Best Practices:
- Redeploy from a Known-Good State: To begin, redeploy from a known-good state. This ensures that your system returns to a stable version, minimizing any lingering issues.
- Run Tests to Validate the Fix: After redeployment, run tests to validate that the fix is effective. This helps confirm that the problem has been resolved and ensures everything is functioning as expected.
- Update Documentation: Finally, update your documentation with the lessons learned from the incident. By doing so, you’ll improve future responses and make your team better prepared for similar challenges down the road.

Conclusion: Kubernetes Incident Response
Kubernetes incident response is more than just troubleshooting; it’s about being proactive, prepared, and adaptable. In fact, by thoroughly understanding your system’s architecture, setting up robust monitoring, and having a clear response plan in place, you can handle incidents much more efficiently. Moreover, remember that every incident is not just a challenge—it’s also an opportunity to learn and improve. So, by staying vigilant and prepared, you ensure that your Kubernetes environment remains resilient, no matter what challenges come your way.
Click here for more insights on various DevOps-Challenge || DevOps-Security topics.
FAQs
What is the primary objective of incident response in Kubernetes?
Answer: The primary goal is to restore services swiftly, reduce downtime, and, importantly, implement measures that prevent the recurrence of similar issues. By focusing on these aspects, you can ensure a more resilient system.
How can I prevent Kubernetes node failures?
Answer: To prevent node failures, you should utilize features like auto-scaling, health checks, and node affinity rules. Additionally, regularly monitoring node health and configuring automatic replacement of failing nodes will help ensure high availability and minimize disruptions.
What tools are best for monitoring Kubernetes Incident Response?
Answer: Prometheus and Grafana are widely used for real-time metrics visualization and monitoring. Moreover, for log analysis, the EFK stack (Elasticsearch, Fluentd, and Kibana) proves to be highly effective, offering a powerful solution for managing logs.
How do I troubleshoot a crashed pod?
Answer: First, begin by inspecting the pod’s logs using kubectl logs, and then review the associated events with kubectl describe pod. By doing this, you can identify the root cause and take the necessary action, such as fixing configuration errors or restarting the pod.
Why is root cause analysis important?
Answer: Root cause analysis is crucial because it helps identify the fundamental issue behind an incident. Once the cause is identified, you can implement long-term fixes, thereby reducing the likelihood of recurring problems and ultimately improving system reliability.
Originally posted 2024-12-04 20:03:27.

